Block Orders
Trigger block trade alerts based on execution side with 3 user adjustable size filters with option to set the volume and if the sound should be on left/right side.
This page will help you setup the addons with sample configuration/settings and screenshots. It is recommended that you adjust the settings based on the contract liquidity/volatility.
If you have any questions or need a custom addon/algo you can get in touch via email: fintechvisuals@gmail.com
The tools were developed and tested on the Futures Market only - If you want to use the tools on any other Market please reach out us.Bookmap Marketplace Link: https://marketplace.bookmap.com/product/fv-orderflow-toolkit/
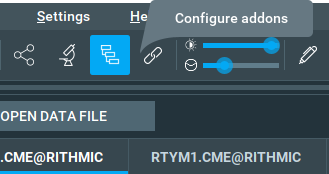
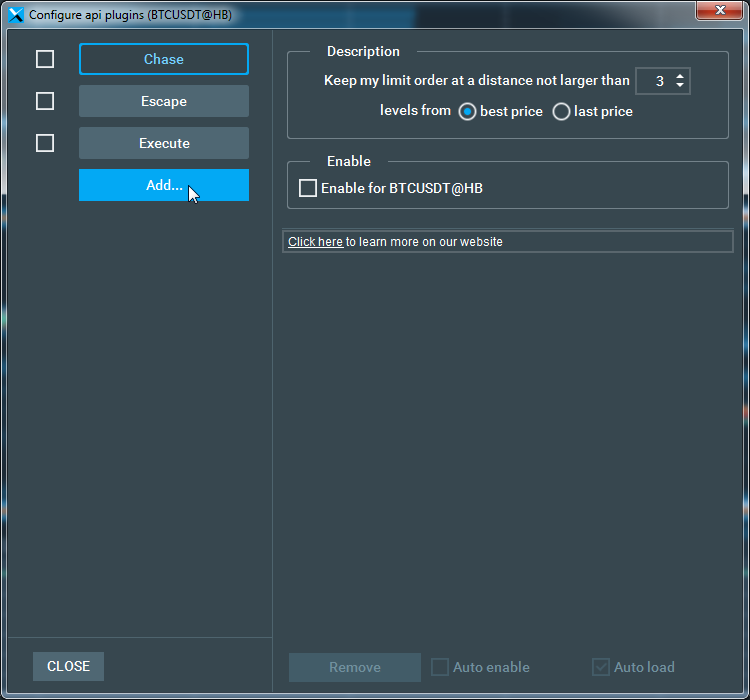
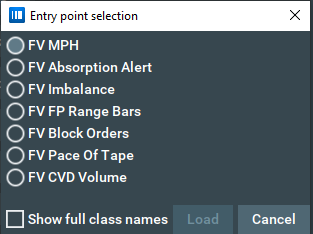
To install the FV Orderflow Toolkit, follow these steps:


Trigger block trade alerts based on execution side with 3 user adjustable size filters with option to set the volume and if the sound should be on left/right side.
Detect high participation rate/liquidity provision trade execution areas commonly referred to as “absorption” with a user defined single or multiple level aggregate volume threshold setting. (Not to be confused with absorption based on a rapid execution of traded volume based on time threshold)
Detects instances that exhibit a sudden increase in trade execution activity commonly referred to as Pace of Tape. With the option to trigger an audio alert when the pace crosses a specific threshold
Cumulative Volume Delta based on a user defined executed volume quantity with a reset threshold using % Imbalance alerts and indicator markers. This addon will alert with a directional arrow when there is an imbalance of Buy vs Sell, it is completely customizable
Trigger alerts when there is an imbalance on the order book, it also has an imbalance line that shows the state of the imbalance between bid vs asks.Much easier to visually identify orderbook imbalance than using Bookmap’s Orderbook Imbalance meter. Directional arrows will appear and point “towards” the resting liquidity as opposed to away from. Based on the concept that liquidity “attracts” price
Identify trading imbalance prices using FootPrint data with Range Bars, when a bar matches the settings it will plot the price, bar high/low on the heatmap and also the direction of the imbalance
Prints the Footprint data (at Range Bar Close) and Range Bar High/Low. The Color will change if bar is UP or Down.